Chapter 06.00: Physical Problem for Regression
Summary
A student wants to pick the best mousetrap out of many for use in a mousetrap car. To do so, one requires to regress the torsion in the mousetrap spring to the angle through which it is opened.
Modeling
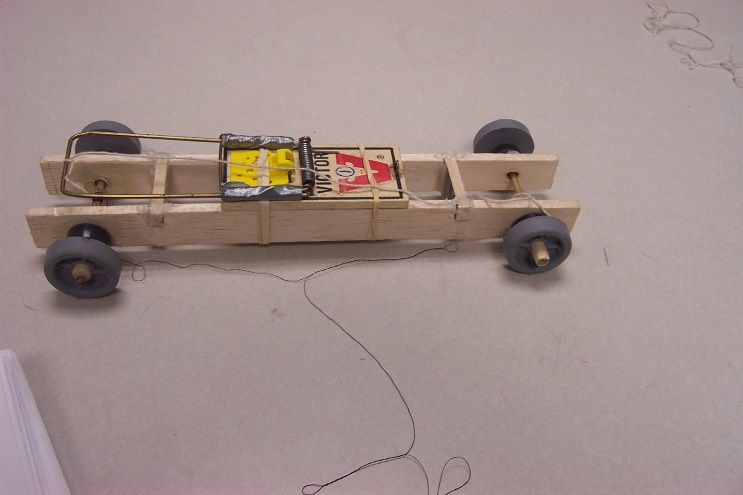
Figure 1 Mousetrap car.
In the Summer of 2003, a high school student worked with me to study the physics of a mousetrap car to build the car that would go the fastest and/or the farthest.
So what is a mousetrap car?
A mousetrap car (Figure 1) is a vehicle that is powered by the energy stored in the spring of a mousetrap. One of the basic ways most mousetrap vehicles are set into motion is by connecting the lever of the mousetrap bar through a string to the car’s axle. As the mousetrap lever is released, the tension that was built up in the spring is released, and the car sets into motion.
So to get the car to go the farthest and fastest, we need to store as much potential energy in the mousetrap spring. Since there is no specification on the mousetrap other than using a certain brand, we could use a mousetrap with the largest spring constant as that would translate to the largest potential energy stored.
Therefore, we bought several mousetrap springs and conducted a simple experiment to determine the spring constant of the mousetrap spring. These values of the spring constant would then allow us to find the potential energy stored in the mousetraps.
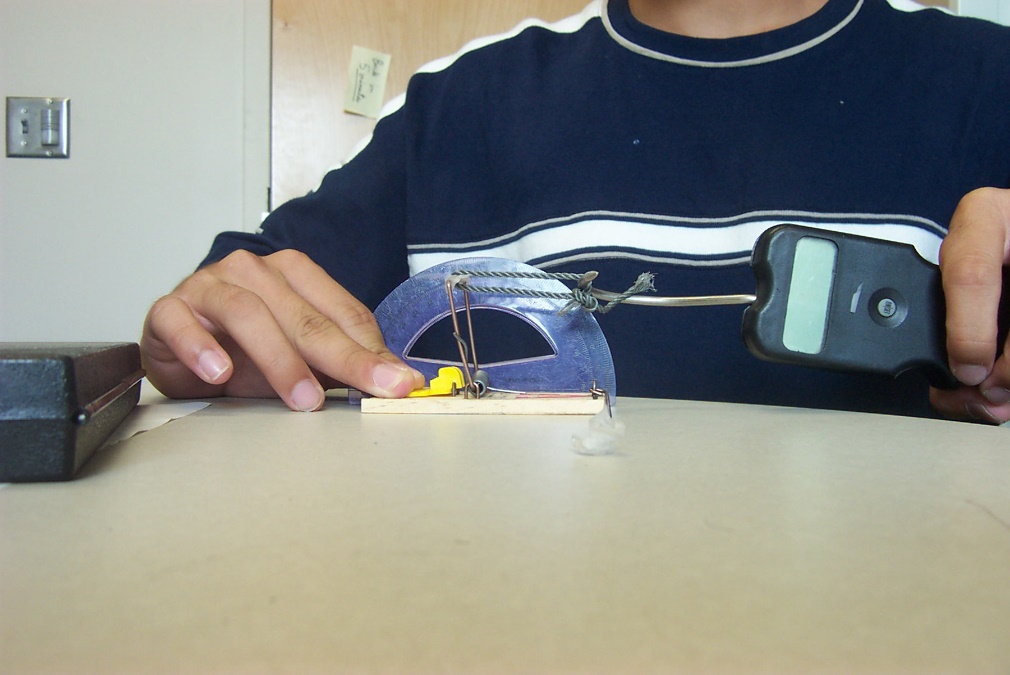
Figure 2 Experimental setup to measure the spring constant.
To find the spring constant of the mousetrap spring, we conducted the following experiment. We pulled the end of the mousetrap lever by a force probe (a fishhook) and measured the angle through which it is pulled by a protractor (Figure 2). We pulled on the end of the spring via a string so that the force on the lever is applied at a right angle to the lever. This way, the torque applied is simply the product of the force, as measured by the fishhook (Figure 3) and the length of the lever arm.
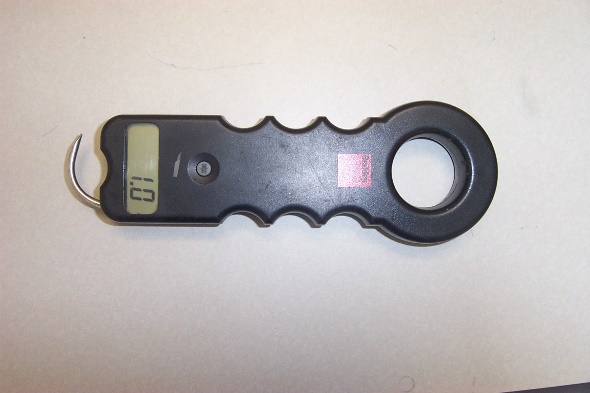
Figure 3 Force probe designed to measure the amount of force an object contains.
We measured the force needed to pull the lever for several different angles. The data for one of the mousetraps is given in Table 1.
The relationship between the torque applied and the angle of the rotation of the spring rotation is assumed to be a straight line
\[T = k_{0} + k_{1}{\theta}\;\;\;\;\;\;\;\;\;\;\;\; (1)\]
where
\[T = \text{Torque}\ \text{(N-m)}\]
\[\theta = \text{Angle through which the spring is rotated}\]
Table 1 Force vs. angle of lever rotation (Mousetrap #1).
| Angle (degrees) | Force (lbs) |
|---|---|
| \(40\) | \(0.9\) |
| \(55\) | \(1.0\) |
| \(65\) | \(1.1\) |
| \(90\) | \(1.2\) |
| \(110\) | \(1.5\) |
The data in Table 1 is converted to the SI system of units, and the torque is calculated using the measured lever moment arm of \(47\ \text{mm}\), that is
\[T = FL\;\;\;\;\;\;\;\;\;\;\;\; (2)\]
where,
\[T =\text{ Torque} \ \text{(N-m)}\]
\[F =\text{Force applied}\ \text{(N)}\]
\[L =\text{ Moment arm}\ \text{(m)}\]
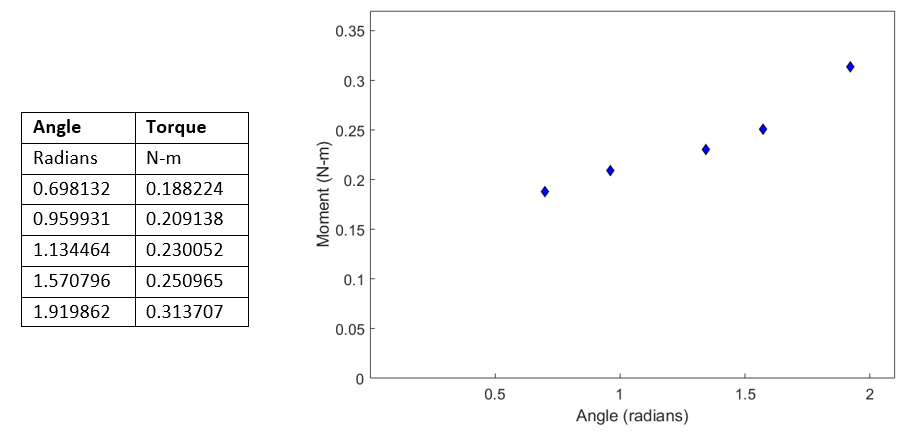
Figure 4 Data and plot of torque vs angle of rotation.
Other mousetrap springs were tested accordingly, and the data is given in Tables 2 and 3.
From these tables, we can find the \(T = k_{0} + k_{1}{\theta}\) relationship for each of three mousetraps. The potential energy, \(U\) stored in the spring would be given by
\[\begin{split} U &= \int_{\theta_{{low}}}^{\theta_{high}}T{d\theta}\\ &= \int_{\theta_{{low}}}^{\theta_{high}}(k_{0} + k_{1}\ \theta)d\theta \end{split}\]
Knowing that in our case, \(\theta_{{low}} = 0\) and \(\theta_{high} = \pi\), the maximum potential energy stored
\[\begin{split} U_{\max} &= \int_{0}^{\pi}(k_{0} + k_{1}\ \theta)d\theta\\ &= k_{0}\pi + k_{1}\frac{\pi^{2}}{2} \end{split}\;\;\;\;\;\;\;\;\;\;\;\; (3)\]
Table 2 Force vs. angle of lever rotation (Mousetrap #2).
| Angle (degrees) | Force (lbs) |
|---|---|
| \(38\) | \(0.9\) |
| \(58\) | \(1.0\) |
| \(65\) | \(1.1\) |
| \(90\) | \(1.2\) |
| \(120\) | \(1.6\) |
Table 3 Force vs. angle of lever rotation (Mousetrap #3).
| Angle (degrees) | Force (lbs) |
|---|---|
| \(40\) | \(0.9\) |
| \(57\) | \(1.0\) |
| \(65\) | \(1.1\) |
| \(90\) | \(1.2\) |
| \(135\) | \(1.7\) |
Questions
(1) Find the constants of the regression model for the spring for the three cases (Tables 1, 2, and 3).
(2) Based on maximum potential energy stored, which of the three springs would you choose?
Summary
To find the diametrical contraction during shrink-fitting in a trunnion requires one to first find how the thermal expansion coefficient of steel is related to temperature. The relation is given through a second-order polynomial regression model.
Modeling
To make the fulcrum (Figure 1) of a bascule bridge, a long hollow steel shaft called the trunnion is shrink fit into a steel hub. The resulting steel trunnion-hub assembly is then shrink fit into the girder of the bridge.
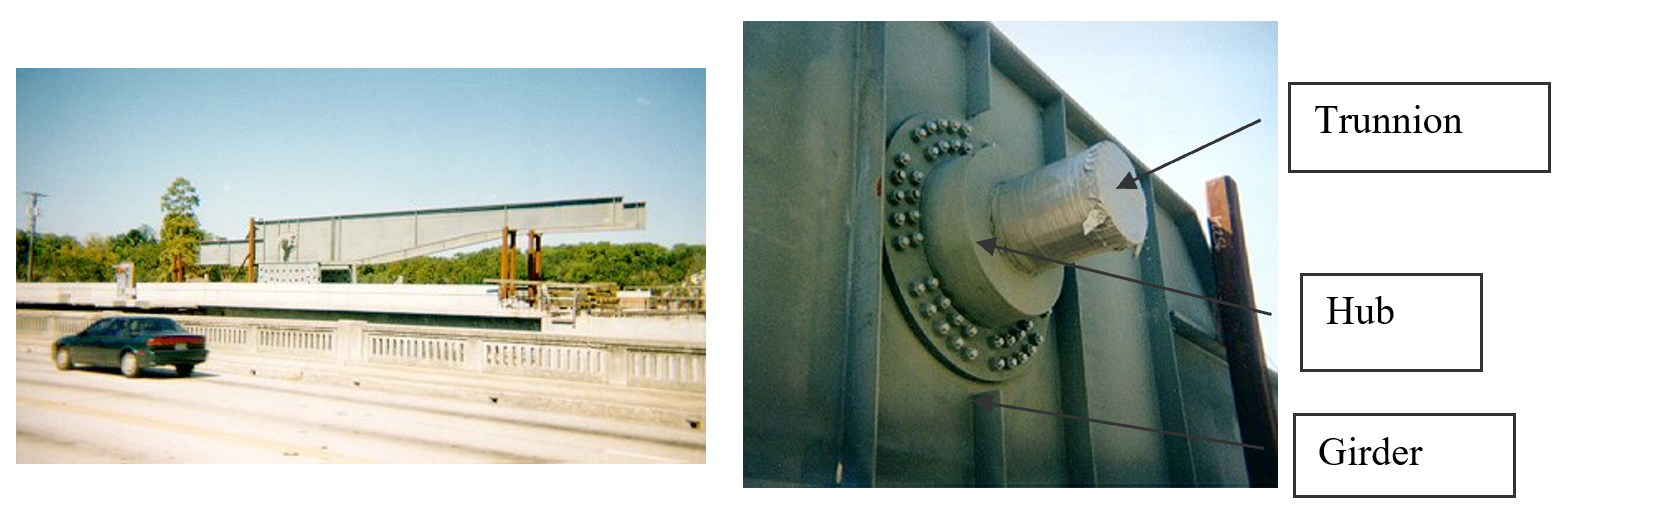
Figure 1 Trunnion-Hub-Girder (THG) assembly.
This shrink-fitting is done by first immersing the trunnion in a cold medium such as a dry-ice/alcohol mixture. After the trunnion reaches the steady-state temperature, that is, the temperature of the cold medium, the trunnion outer diameter contracts. The trunnion is taken out of the medium and slid through the hole of the hub (Figure 2).
When the trunnion heats up, it expands and creates an interference fit with the hub. In 1995, on one of the bridges in Florida, this assembly procedure did not work as designed. Before the trunnion could be inserted fully into the hub, the trunnion got stuck. Luckily, the trunnion was taken out before it got stuck permanently. Otherwise, a new trunnion and hub would be needed to be ordered at the cost of $50,000. Coupled with construction delays, the total loss could have been more than a hundred thousand dollars.
Why did the trunnion get stuck? This failure was because the trunnion had not contracted enough to slide through the hole. Can you find out why?
A hollow trunnion of outside diameter \({12.36}{3}{^{\prime\prime} }\) is to be fitted in a hub of inner diameter \(12.358{^{\prime\prime} }\). The trunnion was put in a dry ice/alcohol mixture (temperature of the fluid - dry ice/alcohol mixture is \(- 108{^\circ}\text{F}\)) to contract the trunnion so that it can be slid through the hole of the hub. To slide the trunnion without sticking, a diametrical clearance of at least \(0.01{^{\prime\prime} }\) is required between the trunnion and the hub. Assuming the room temperature is \(80{^\circ}\text{F}\), is immersing it in a dry-ice/alcohol mixture a correct decision?
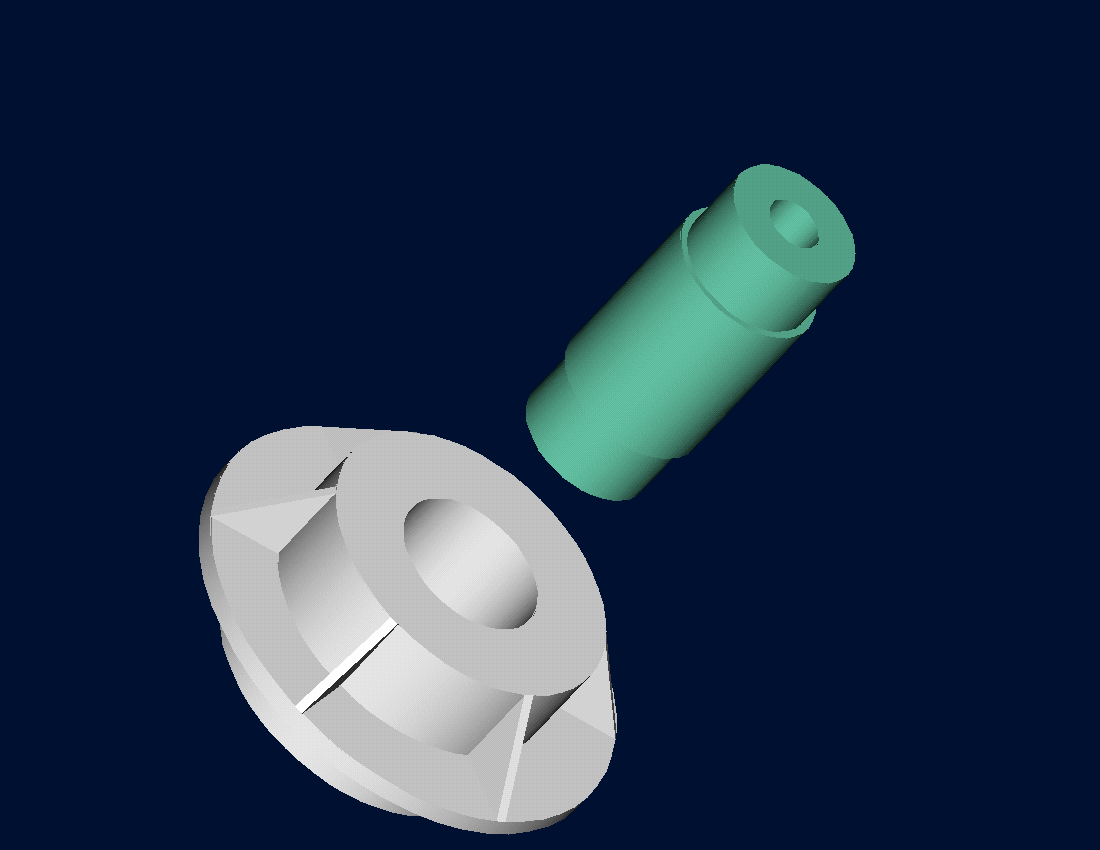
Figure 2 Trunnion slid through the hub after contracting.
Solution
To calculate the contraction in the diameter of the trunnion, coefficient of linear thermal expansion at room temperature is used. In that case the reduction, \({\Delta D}\) in the outer diameter of the trunnion is
\[\Delta D = D\alpha\Delta T\;\;\;\;\;\;\;\;\;\;\;\; (1)\]
where
\[D = \text{outer diameter of the trunnion,}\]
\[\alpha = \text{coefficient of linear thermal expansion at room temperature, and}\]
\[\Delta T = \text{change in temperature.}\]
Given
\[D = 12.363{^{\prime\prime} }\]
\[\alpha = 6.817 \times 10^{- 6}\ \text{in/in/}{^\circ}\text{F}\text{ at }80{^\circ}\text{F}\]
\[\begin{split} \Delta T&=T_{{fluid}} - T_{{room}}\\ &= - 188{^\circ}\text{F} \end{split}\]
where
\[T_{{fluid}} = \text{temperature of dry-ice/alcohol mixture,}\]
\[T_{{room}} = \text{room temperature,}\]
the reduction in the trunnion outer diameter (Equation 1) is given by
\[\begin{split} \Delta D &= (12.363)\left( 6.47 \times 10^{- 6} \right)\left( - 188 \right)\\ &= - 0.01504^{\prime\prime} \end{split}\]
So the trunnion is predicted to reduce in diameter by \(0.01504{^{\prime\prime} }\). But is this enough reduction in diameter? As per specifications, he needs the trunnion to contract by
\[\begin{split} &= \text{trunnion outside diameter - hub inner diameter + diametric clearance}\\ &= 12.363^{\prime\prime} - 12.358^{\prime\prime} + 0.01^{\prime\prime} \\ &= 0.015^{\prime\prime} \end{split}\]
So, according to his calculations, immersing the steel trunnion in a dry-ice/alcohol mixture gives the desired contraction of \(0.015^{\prime\prime}\) as we predict a contraction of \(0.01504{^{\prime\prime} }\).
But as shown in Figure 3 and Table 1, the coefficient of linear thermal expansion of steel decreases with temperature and is not constant over the range of temperature the trunnion goes through. Hence, the above formula (Equation 1) would overestimate the thermal contraction.
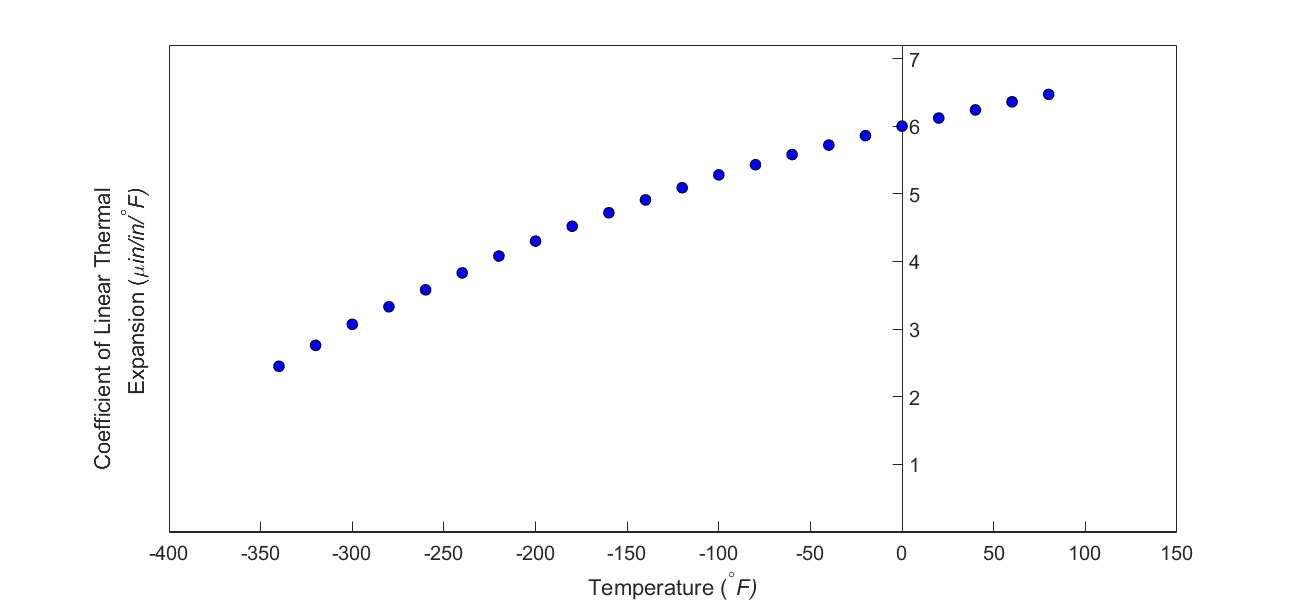
Figure 3 Varying coefficient of linear thermal expansion as a function of temperature for cast steel.
The contraction in the diameter for the trunnion for which the coefficient of linear thermal expansion varies as a function of temperature is given by
\[\Delta D = D\int_{T_{{room}}}^{T_{{fluid}}}{\alpha dT}\;\;\;\;\;\;\;\;\;\;\;\; (2)\]
So one needs to find the curve to find the coefficient of linear thermal expansion as a function of temperature. This curve is found by regression where we best fit a function through the data given in Table 1. In this case, we may fit a second-order polynomial
\[\alpha = a_{0} + a_{1} \times T + a_{2} \times T^{2}.\;\;\;\;\;\;\;\;\;\;\;\; (3)\]
The values of the coefficients in the above equations will be found by polynomial regression. Knowing the values of \(a_{0}\), \(a_{1}\),and \(a_{2}\), we can then find the contraction in the trunnion diameter from Equation (2) and (3) as
\[\begin{split} \Delta D &= D\int_{T_{{room}}}^{T_{{fluid}}}{(a_{0} + a_{1} \times T + a_{2} \times T^{2}})dT\\ &= D\lbrack a_{0} \times (T_{{fluid}} - T_{{room}}) + a_{1} \times \frac{({T_{{fluid}}}^{2} - {T_{{room}}}^{2})}{2} + a_{2} \times \frac{({T_{{fluid}}}^{3} - {T_{{room}}}^{3})}{3}\rbrack\;\;\;\;\;\;\;\;\;\;\;\; (4) \end{split}\]
Questions
(1) Find the contraction in the outer diameter of the trunnion.
(2) As required, is the magnitude of contraction more than \(0.015{^{\prime\prime} }\)?
(3) If the magnitude of the contraction is less than \(0.015{^{\prime\prime} }\), what if the trunnion were immersed in liquid nitrogen (boiling temperature\(= - 321{^\circ}F\))? Will that give enough contraction in the trunnion?
(4) Rather than regressing the data to a second-order polynomial so that one can find the contraction in the outer diameter of the trunnion, how would you use the trapezoidal rule of integration for unequal segments to find the contraction? What is the relative difference between the two results? The data for the coefficient of linear thermal expansion as a function of temperature is given in Table 1.
(5) We chose a second-order polynomial for regression. What would make a different order polynomial a better choice for regression? Is there an optimum order of polynomial you can find?
Table 1 Coefficient of linear thermal expansion as a function of temperature.
| Temperature | Coefficient of Thermal Expansion |
|---|---|
| \({^\circ}F\) | \({\mu}{in}{/}{in/}{{^\circ}}{F}\) |
| \(80\) | \(6.47\) |
| \(60\) | \(6.36\) |
| \(40\) | \(6.24\) |
| \(20\) | \(6.12\) |
| \(0\) | \(6.00\) |
| \(-20\) | \(5.86\) |
| \(-40\) | \(5.72\) |
| \(-60\) | \(5.58\) |
| \(-80\) | \(5.43\) |
| \(-100\) | \(5.28\) |
| \(-120\) | \(5.09\) |
| \(-140\) | \(4.91\) |
| \(-160\) | \(4.72\) |
| \(-180\) | \(4.52\) |
| \(-200\) | \(4.30\) |
| \(-220\) | \(4.08\) |
| \(-240\) | \(3.83\) |
| \(-260\) | \(3.58\) |
| \(-280\) | \(3.33\) |
| \(-300\) | \(3.07\) |
| \(-320\) | \(2.76\) |
| \(-340\) | \(2.45\) |