HOW DO I DO THAT IN MATLAB SERIES?
In this series, I am answering questions that students have asked me about MATLAB.
Contents
TOPIC
How to plot in MATLAB
SUMMARY
Language : Matlab 2008a; Authors : Sri Harsha Garapati, Daniel Miller, Autar Kaw; Mfile available at Last Revised : January 17, 2012; Abstract: This program shows how to plot in MATLAB
clc
clear all
INTRODUCTION
disp('ABSTRACT')
disp('   This program shows how to plot in MATLAB')

disp(' ')
disp('AUTHOR')
disp('   Sri Harsha Garapati, Daniel Miller and')
disp('Autar K Kaw of http://autarkaw.wordpress.com')
disp(' ')
disp('MFILE SOURCE')
disp('   http://numericalmethods.eng.usf.edu/blog/plot_section001_blog.m')
disp(' ')
disp('LAST REVISED')
disp('   January 17, 2012')
disp(' ')
ABSTRACT
   This program shows how to plot in MATLAB

AUTHOR
   Sri Harsha Garapati, Daniel Miller and
Autar K Kaw of http://autarkaw.wordpress.com

MFILE SOURCE
   http://numericalmethods.eng.usf.edu/blog/plot_section001_blog.m

LAST REVISED
   January 17, 2012
INPUTS
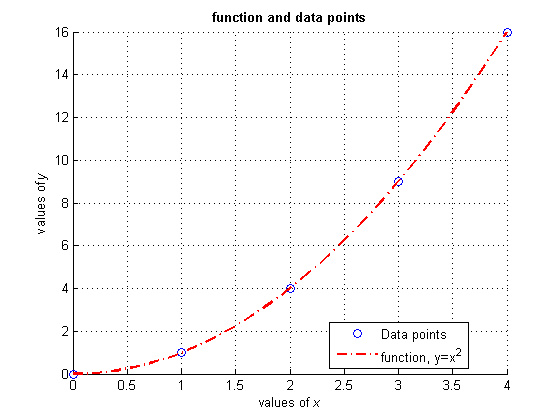
% data points to be plotted
xp=[0 1 2 3 4];     % x data points
yp=[0 1 4 9 16];    % y data points
DISPLAYING INPUTS
disp('INPUTS')
disp('  Data points to be plotted:')
disp('     x    y')
disp('   ----------')
disp([xp;yp]')
INPUTS
  Data points to be plotted:
     x    y
   ----------
     0     0
     1     1
     2     4
     3     9
     4    16
THE CODE
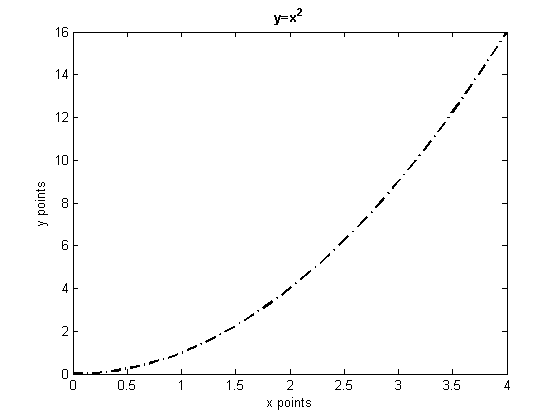
% setting up the function to be plotted
xf=[0:0.1:4];       % x domain as a vector
yf=xf.^2;           % y function to be plotted
% plotting the first figure (data points and function)
figure(1)
hold on
plot(xp,yp,'bo','MarkerSize',6)
plot(xf,yf,'r-.','LineWidth',2)
title('\bffunction and data points')
xlabel('values of \itx')
ylabel('values of \ity')
legend('Data points','function, y=x^2',0)
grid on
hold off

% plotting the second figure (only the function)
figure(2)
plot(xf,yf,'k-.','LineWidth',2)
title('\bfy=x^{2}')
xlabel('x points')
ylabel('y points')
grid off
DISPLAYING OUTPUTS
disp('  ')
disp('OUTPUTS')
disp('  See attached plots')
OUTPUTS
  See attached plots