HOW DO I DO THAT IN MATLAB SERIES?
In this series, I am answering questions that students have asked me about MATLAB. Most of the questions relate to a mathematical procedure.
Contents
TOPIC
How do I conduct spline interpolation for given data.
SUMMARY
Language : Matlab 2010a; Authors : Autar Kaw and Sri Harsha Garapati; Mfile available at Last Revised : January 23, 2012; Abstract: This program shows you how to perform spline interpolation in MATLAB
clc
clear all
clf
INTRODUCTION
disp('ABSTRACT')
disp('   This program shows you how to perform spline interpolation')

disp(' ')
disp('AUTHOR')
disp('   Autar Kaw and Sri Harsha Garapati of http://autarkaw.wordpress.com')
disp(' ')
disp('MFILE SOURCE')
disp('   http://numericalmethods.eng.usf.edu/blog/interpolation_spline_sec002_blog.m')
disp(' ')
disp('LAST REVISED')
disp('   January 23, 2012')
disp(' ')
ABSTRACT
   This program shows you how to perform spline interpolation

AUTHOR
   Autar Kaw and Sri Harsha Garapati of http://autarkaw.wordpress.com

MFILE SOURCE
   http://numericalmethods.eng.usf.edu/blog/interpolation_spline_sec002_blog.m

LAST REVISED
   January 23, 2012
INPUTS
% Inputs
% x cordinates of data
xd  =[2 5.1 7.7 9.2 10.3];
% y cordinates of date
yd  =[1.4 3.3 5.7 10.4 12.5];
% xvalue at which y is to be predicted using spline interpolation
xval=6.5;
DISPLAYING INPUTS
disp('  ')
disp('INPUTS')
% Creating a matrix to print input data as a table
data=[xd;yd]';
disp('   X Data     Y Data')
% Printing the input data as a table
disp(data)
% Printing the input value of X at which Y is to be predicted using spline
% interpolation
fprintf('  Predict the value of y when x is %g\n\n',xval)
INPUTS
   X Data     Y Data
    2.0000    1.4000
    5.1000    3.3000
    7.7000    5.7000
    9.2000   10.4000
   10.3000   12.5000

  Predict the value of y when x is 6.5
THE CODE
% Predicting the value of y at xval using spline interpolation
yval=spline(xd,yd,xval);

% setting up the domain to plot the spline interpolation
xp  =[min(xd):0.1:max(xd)];
% evaluating over domain xp for plotting the spline interpolation function
yp  =spline(xd,yd,xp);
DISPLAYING OUTPUTS AND PLOTS
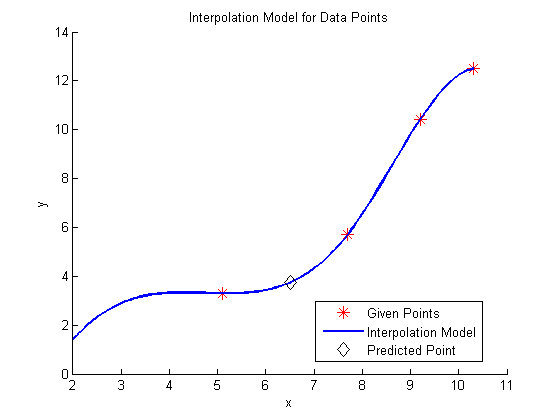
disp('  ')
disp('OUTPUTS')
% printing the predicted value of y
fprintf('  Predicted value of y is %g\n',yval)

disp('  See figure(1)')
% Telling Matlab to name the figure as Figure-1
figure(1)
% Matlab command so that it does hold on to all the plots
hold on
% plotting the data points
plot(xd,yd,'r*','MarkerSize',10)
% plotting the interpolation function
plot(xp,yp,'b-','LineWidth',2)
% plotting the predicted data point value
plot(xval,yval,'kd','MarkerSize',10)
% Title of the Plot
title('Interpolation Model for Data Points')
% Legend to distunguish different plots
legend('Given Points','Interpolation Model','Predicted Point',0)
% Labeling the X-axis
xlabel('x')
% Labeling the Y-Axis
ylabel('y')
% Matlab command to exit the hold-on option
hold off
OUTPUTS
  Predicted value of y is 3.74359
  See figure(1)