HOW DO I DO THAT IN MATLAB SERIES?
In this series, I am answering questions that students have asked me about MATLAB. Most of the questions relate to a mathematical procedure.
Contents
TOPIC
How do I do spline interpolation?
SUMMARY
% Language : Matlab 2008a;
% Authors : Autar Kaw;
% Mfile available at
% http://numericalmethods.eng.usf.edu/blog/interpolate_spline.m;
% Last Revised : June 20, 2009;
% Abstract: This program shows you how to do spline interpolation?
%           .
clc
clear all
clf
INTRODUCTION
disp('ABSTRACT')
disp('   This program shows you how to do spline interpolation?')
disp(' ')
disp('AUTHOR')
disp('   Autar K Kaw of http://autarkaw.wordpress.com')
disp(' ')
disp('MFILE SOURCE')
disp('   http://numericalmethods.eng.usf.edu/blog/interpolation_spline.m')
disp(' ')
disp('LAST REVISED')
disp('   June 20, 2009')
disp(' ')
ABSTRACT
   This program shows you how to do spline interpolation?

AUTHOR
   Autar K Kaw of http://autarkaw.wordpress.com

MFILE SOURCE
   http://numericalmethods.eng.usf.edu/blog/interpolation_spline.m

LAST REVISED
   June 20, 2009
INPUTS
y vs x data to interpolate x data
x=[-1  -0.75  -0.5  -0.25   0.25  0.50 0.75  1];
% ydata
y=[-0.5  -0.5  -0.5  -0.5   0.5  0.5  0.5  0.5];
% Where do you want to interpolate at
xin=[-0.8  -0.7  0.7  0.8];
DISPLAYING INPUTS
disp('INPUTS')
disp('The x data')
x
disp('The y data')
y
disp('The x values where you want to find the interpolated values')
xin
disp('  ')
INPUTS
The x data

x =

   -1.0000   -0.7500   -0.5000   -0.2500    0.2500    0.5000    0.7500    1.0000

The y data

y =

   -0.5000   -0.5000   -0.5000   -0.5000    0.5000    0.5000    0.5000    0.5000

The x values where you want to find the interpolated values

xin =

   -0.8000   -0.7000    0.7000    0.8000
THE CODE
Fitting to spline - it is cubic splines
yin=spline(x,y,xin);
% This is only for plotting the spline interpolants
% Find the number of data points
n=length(x);
xplot=x(1):(x(n)-x(1))/10000:x(n);
yplot=spline(x,y,xplot);
DISPLAYING OUTPUTS
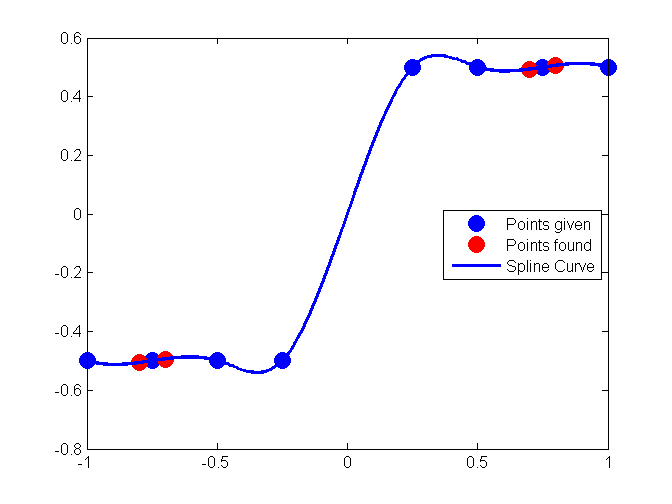
disp('  ')
disp('OUTPUTS')
disp('x values at which function is to be interpolated')
xin
disp('y values at the xin values')
yin
xlabel('x');
ylabel('y');
title('y vs x ');
plot(x,y,'o','MarkerSize',10,'MarkerEdgeColor','b','MarkerFaceColor','b')
hold on
plot(xin,yin,'o','MarkerSize',10,'MarkerEdgeColor','r','MarkerFaceColor','r')
hold on
plot(xplot,yplot,'LineWidth',2)
legend('Points given','Points found','Spline Curve','Location','East')
hold off
disp('  ')
OUTPUTS
x values at which function is to be interpolated

xin =

   -0.8000   -0.7000    0.7000    0.8000

y values at the xin values

yin =

   -0.5064   -0.4936    0.4936    0.5064