HOW DO I DO THAT IN MATLAB SERIES?
In this series, I am answering questions that students have asked me about MATLAB. Most of the questions relate to a mathematical procedure.
Contents
TOPIC
How do I do polynomial interpolation?
SUMMARY
% Language : Matlab 2008a;
% Authors : Autar Kaw;
% Mfile available at
% http://numericalmethods.eng.usf.edu/blog/interpolate_polynomial.m;
% Last Revised : June 10, 2009;
% Abstract: This program shows you how to do polynomial interpolation?
%           .
clc
clear all
clf
INTRODUCTION
disp('ABSTRACT')
disp('   This program shows you how to do polynomial interpolation?')
disp(' ')
disp('AUTHOR')
disp('   Autar K Kaw of http://autarkaw.wordpress.com')
disp(' ')
disp('MFILE SOURCE')
disp('   http://numericalmethods.eng.usf.edu/blog/interpolation_polynomial.m')
disp(' ')
disp('LAST REVISED')
disp('   June 10, 2009')
disp(' ')
ABSTRACT
   This program shows you how to do polynomial interpolation?

AUTHOR
   Autar K Kaw of http://autarkaw.wordpress.com

MFILE SOURCE
   http://numericalmethods.eng.usf.edu/blog/interpolation_polynomial.m

LAST REVISED
   June 10, 2009
INPUTS
y vs x data to interpolate x data
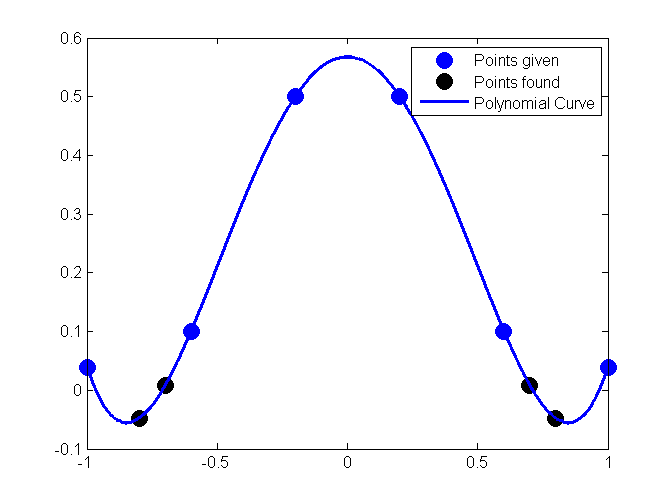
x=[-1  -0.6  -0.2  0.2  0.6  1];
% ydata
y=[0.0385    0.1000    0.5000    0.5000    0.1000    0.0385];
% Where do you want to interpolate at
xin=[-0.8  -0.7  0.7  0.8];
DISPLAYING INPUTS
disp('INPUTS')
disp('The x data')
x
disp('The y data')
y
disp('The x values where you want to find the interpolated values')
xin
disp('  ')
INPUTS
The x data

x =

   -1.0000   -0.6000   -0.2000    0.2000    0.6000    1.0000

The y data

y =

    0.0385    0.1000    0.5000    0.5000    0.1000    0.0385

The x values where you want to find the interpolated values

xin =

   -0.8000   -0.7000    0.7000    0.8000
THE CODE
Find the number of data points
n=length(x);
% Fitting to polynomial of order m=n-1
m=n-1
% pp consists of the coefficients of the polynomial
% pp(1)*x^m+pp(2)*x^m+.......+pp(m)
% pp(1) is coefficient of x^m
% pp(2) is coefficient of x^(m-1)
% and so on
pp=polyfit(x,y,m);
% Getting the values at xin
yin=polyval(pp,xin);
% This is only for plotting the interpolating polynomial
xplot=x(1):(x(n)-x(1))/10000:x(n);
yplot=polyval(pp,xplot);
m =

     5
DISPLAYING OUTPUTS
disp('  ')
disp('OUTPUTS')
disp('x values at which function is to be interpolated')
xin
disp('y values at the xin values')
yin
disp('These are the coefficients of the polynomial interpolant')
disp('pp(1) is coefficient of x^m, pp(2) is coefficient of x^(m-1) and so on')
fprintf('Order of polynomial m =%g',m)
pp
xlabel('x');
ylabel('y');
title('y vs x ');
plot(x,y,'o','MarkerSize',10,'MarkerEdgeColor','b','MarkerFaceColor','b')
hold on
plot(xin,yin,'o','MarkerSize',10,'MarkerEdgeColor','k','MarkerFaceColor','k')
hold on
plot(xplot,yplot,'LineWidth',2)
legend('Points given','Points found','Polynomial Curve')
hold off
disp('  ')
OUTPUTS
x values at which function is to be interpolated

xin =

   -0.8000   -0.7000    0.7000    0.8000

y values at the xin values

yin =

   -0.0481    0.0078    0.0078   -0.0481

These are the coefficients of the polynomial interpolant
pp(1) is coefficient of x^m, pp(2) is coefficient of x^(m-1) and so on
Order of polynomial m =5
pp =

    0.0000    1.2020   -0.0000   -1.7308    0.0000    0.5673